MAD Carbon Impact
Our 2023-2024 Sustainability Journey
The Bigger Picture
Making a Difference
One Tonne at a Time
At MAD Wealth, we’re all about Making a Difference—it’s literally in our name. For over 4 years, we’ve been on a mission to unlock the good in every business and use it to create real, positive change in the world.
Our team of 10 awesome humans, working across Australia, Brunei, and the Philippines, is committed to doing business better. That means being smart, intentional, and accountable about our impact—especially when it comes to carbon.
That’s why we’ve partnered with Trace to measure our emissions and kickstart our journey to Net Zero. For the period July 2023 to June 2024, we measured 27.2 tonnes of CO₂e—and here’s the best part: we didn’t just offset it, we went above and beyond and offset 150% of our emissions.
This report is a snapshot of where we’re at, what we’ve learned, and how we’re taking action. Because sustainability isn’t just a goal—it’s how we do business.
OUR ‘MAD’ FOOTPRINT
Between July 1, 2023, and June 30, 2024, our total carbon footprint came in at 27.2 tonnes of CO₂e. That’s a 26% increase from last year—mostly because we’ve been growing (which is a good thing, right?). With 10 full-time team members, that averages out to 2.7 tonnes per person.
Let’s break it down by scope:
- Scope 1: We don’t own vehicles or burn fuel directly, so we’re squeaky clean here.
- Scope 2: This is from the electricity we use in our office.
- Scope 3: This is where the bulk of our footprint lives: supply chain, services, travel, and everything in between.
In fact, Scope 3 makes up 94.9% of our total emissions. That’s huge—and pretty typical for a digital-first, service-based business like ours.
The biggest contributors? Purchased goods and services, electricity, and business travel.
Total Footprint: 27.2t
| Source | Emissions | % total emissions |
|---|---|---|
| Electricity | 8.5t | 31% |
| Business travel | 5.7t | 21% |
| Employee commute | 0.3t | <1% |
| Purchased goods & services | 12.8t | 47% |
| Waste generated | 0.3kg | <1% |
Together, they account for 99% of our total footprint. Our hybrid work setup means we’re using more electricity at home and commuting less, which definitely shapes our emissions profile.
OUR BENCHMARK
Industry Benchmark
Our carbon footprint for 2023–2024 hit 27.2 tonnes of CO₂e, or 2.7 tonnes per employee. That’s a 26.2% increase compared to last year’s 21.4 tonnes (2.1 tonnes per employee).
What changed?
- Purchased goods & services rose from 8.8 to 12.8 tonnes (+45%).
- Business travel jumped from 3.4 to 5.7 tonnes (+68%).
- Electricity slightly decreased from 8.7 to 8.5 tonnes (-2%).
- Employee commute dropped from 0.5 to 0.3 tonnes (-40%).
Year-over-Year Comparison
Here’s how our emissions stack up over the last two periods:
Emissions Comparison: 2022–2023 vs 2023–2024
What it means for us?
While accounting services typically see lower direct emissions compared to manufacturing or heavy industries, our increase this year highlights indirect emissions—especially from suppliers and travel.
This reflects a mix of business growth and the return of in-person travel post-pandemic.
Next steps…
We need to double down on supplier engagement, smarter travel policies, and energy efficiency to reverse this trend and outperform our peers. Benchmarking shows us where we stand—and this year’s rise is our cue to act fast.
Electricity
We clocked in 8.5 tonnes of CO₂e from electricity use—that’s 31.1% of our total emissions.
Here’s the interesting part: a whopping 83.4% of that came from our team working from home (yep, that’s 7.1 tonnes). The office? Just 1.4 tonnes, or 16.6%. So yeah, remote work definitely leaves a mark on our footprint.
Electricity Emissions by Location
Not all electricity is created equal—and neither are the emissions that come with it. Here’s how our electricity-related carbon footprint breaks down across the places we work:
- Philippines – WFH: This one tops the list, with 5.6 tonnes of CO₂, making up a massive 66.3% of our electricity emissions.
- Northern Territory, Australia – WFH: Coming in next is the NT, with 1.4 tonnes of CO₂, or 17.1% of our electricity emissions.
- Miranda NSW, Australia – Office: Our office space in Miranda contributes 1.4 tonnes of CO₂ too, which is 16.6% of the total.
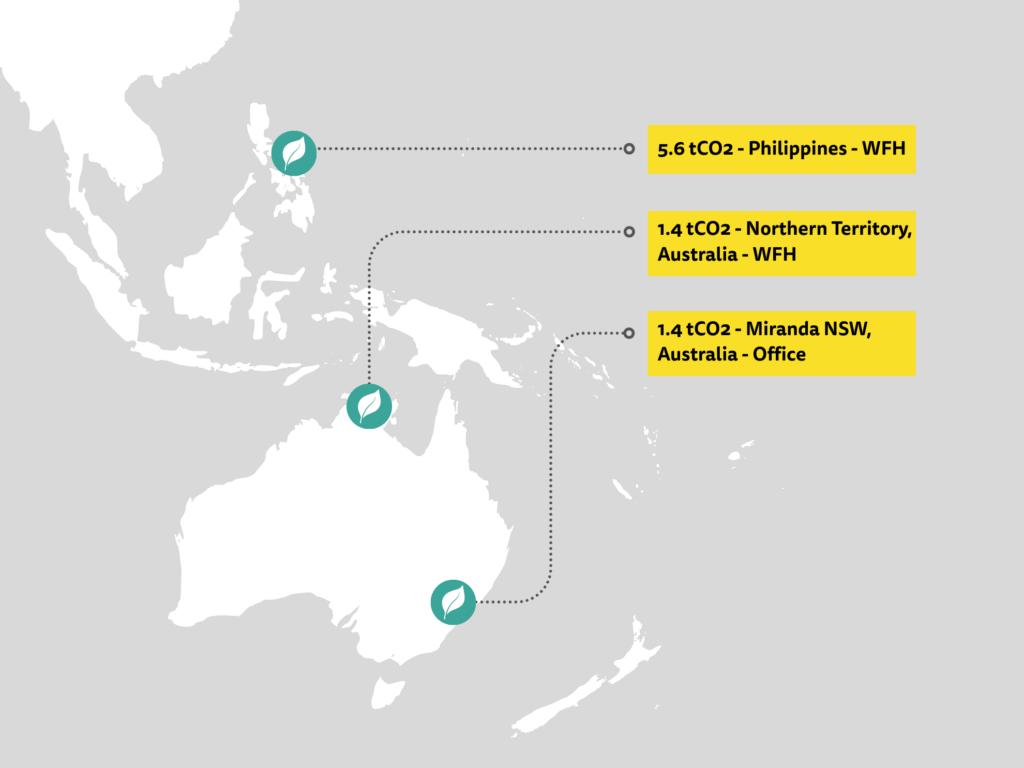
This breakdown shows how our team’s locations—and how we work—shape our impact. It’s a good reminder that even remote work has its carbon cost.
Business Travel
Our business travel racked up 5.7 tonnes of CO₂e, which makes up 20.9% of our total emissions.
No surprise here—air travel is the biggest culprit, responsible for a hefty 71.3% of our business travel footprint. Next up is accommodation at 17.3%, and private transport rounds it out with 11.4%.
So yeah, flights are doing most of the damage. If we’re looking for ways to cut back, air travel is definitely where we should start.
Employee Commute
Our team’s commuting added up to 1.2 tonnes of CO₂e—that’s about 4.4% of our total emissions.
Most of that (a solid 75%) came from personal vehicles. The rest (25%) was from public transport. So while we’re not driving company cars, how we get to work still makes a difference.
There’s definitely room to improve here—whether it’s carpooling, hopping on a train, or working from home a little more often.

Purchased Goods & Services
The stuff we bought—think gear, services, supplies—added up to 11.8 tonnes of CO₂e, which is 43.4% of our total emissions. Yep, nearly half!
The biggest contributors? IT equipment and office supplies, making up 68% of this category. The rest (32%) comes from things like professional services and marketing materials.
This shows how much our purchasing decisions matter. If we want to shrink our footprint, switching to more sustainable sourcing is a smart place to start.
Waste Generated
Our waste-related emissions added up to 1.5 tonnes of CO₂e, which is about 5.5% of our total footprint.
Most of that—60%—came from everyday office waste. The other 40%? That’s from electronic waste (yep, those old cables and keyboards add up).
It’s a small slice of our footprint, but still worth tackling.
Better recycling habits and smarter waste management could help us bring this number down even more.
OUR CARBON JOURNEY
Opportunities
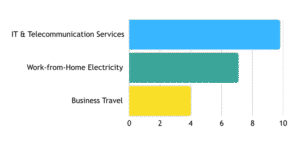
We have identified several high-impact areas where we can make significant reductions in our ongoing efforts to reduce our carbon footprint.
- IT & Telecommunication Services (9.8 tCO₂e – 36%)
- Evaluate cloud service providers with renewable energy commitments
- Optimise software subscriptions and eliminate unused services
- Choose providers with strong sustainability credentials
- Work-from-Home Electricity (7.1 tCO₂e – 26%)
- Employee engagement on home energy efficiency
- Support for renewable energy adoption at home
- Energy-efficient equipment policies
- Business Travel – Air Travel (4.0 tCO₂e – 15%)
- Virtual meeting policies to reduce flight frequency
- Direct flight preferences when travel is necessary
- Carbon offset programs for unavoidable flights
Targets
In our pursuit of reducing carbon emissions and enhancing sustainability, we have outlined three key targets.
Establish Clear Objectives
Setting specific outcomes, scopes, end dates, and baselines for emissions reduction
Set Interim Milestones
Breaking down the journey into short-term, medium-term, and long-term goals.
Recommended Approach
Focus on high-impact Scope 3 categories and set supplier engagement targets for IT services.
Decarbonisation Plan
In Progress
We’re not just talking about Net Zero—we’re making moves. Here’s what’s already in the works:
- Switching to Cloud PCs - We're phasing out traditional hardware and moving to cloud-based desktops. Why? Less physical tech means less e-waste. It’s a smart step under our Waste Generated category.
- Tracking Our CO₂ Emissions Annually - You can’t reduce what you don’t measure. We’re now tracking our carbon footprint every year to stay accountable and keep our Net Zero Strategy on track.
OUR PEOPLE
Our team's all in!
Every single person on our team—yep, all 10 of us—is genuinely committed to taking climate action. It’s not just something we say; it’s something we live. From the way we work to the choices we make at home, sustainability is part of our everyday.
We’ve been recognised for walking the talk, and that’s because our people are at the heart of our decarbonisation journey.
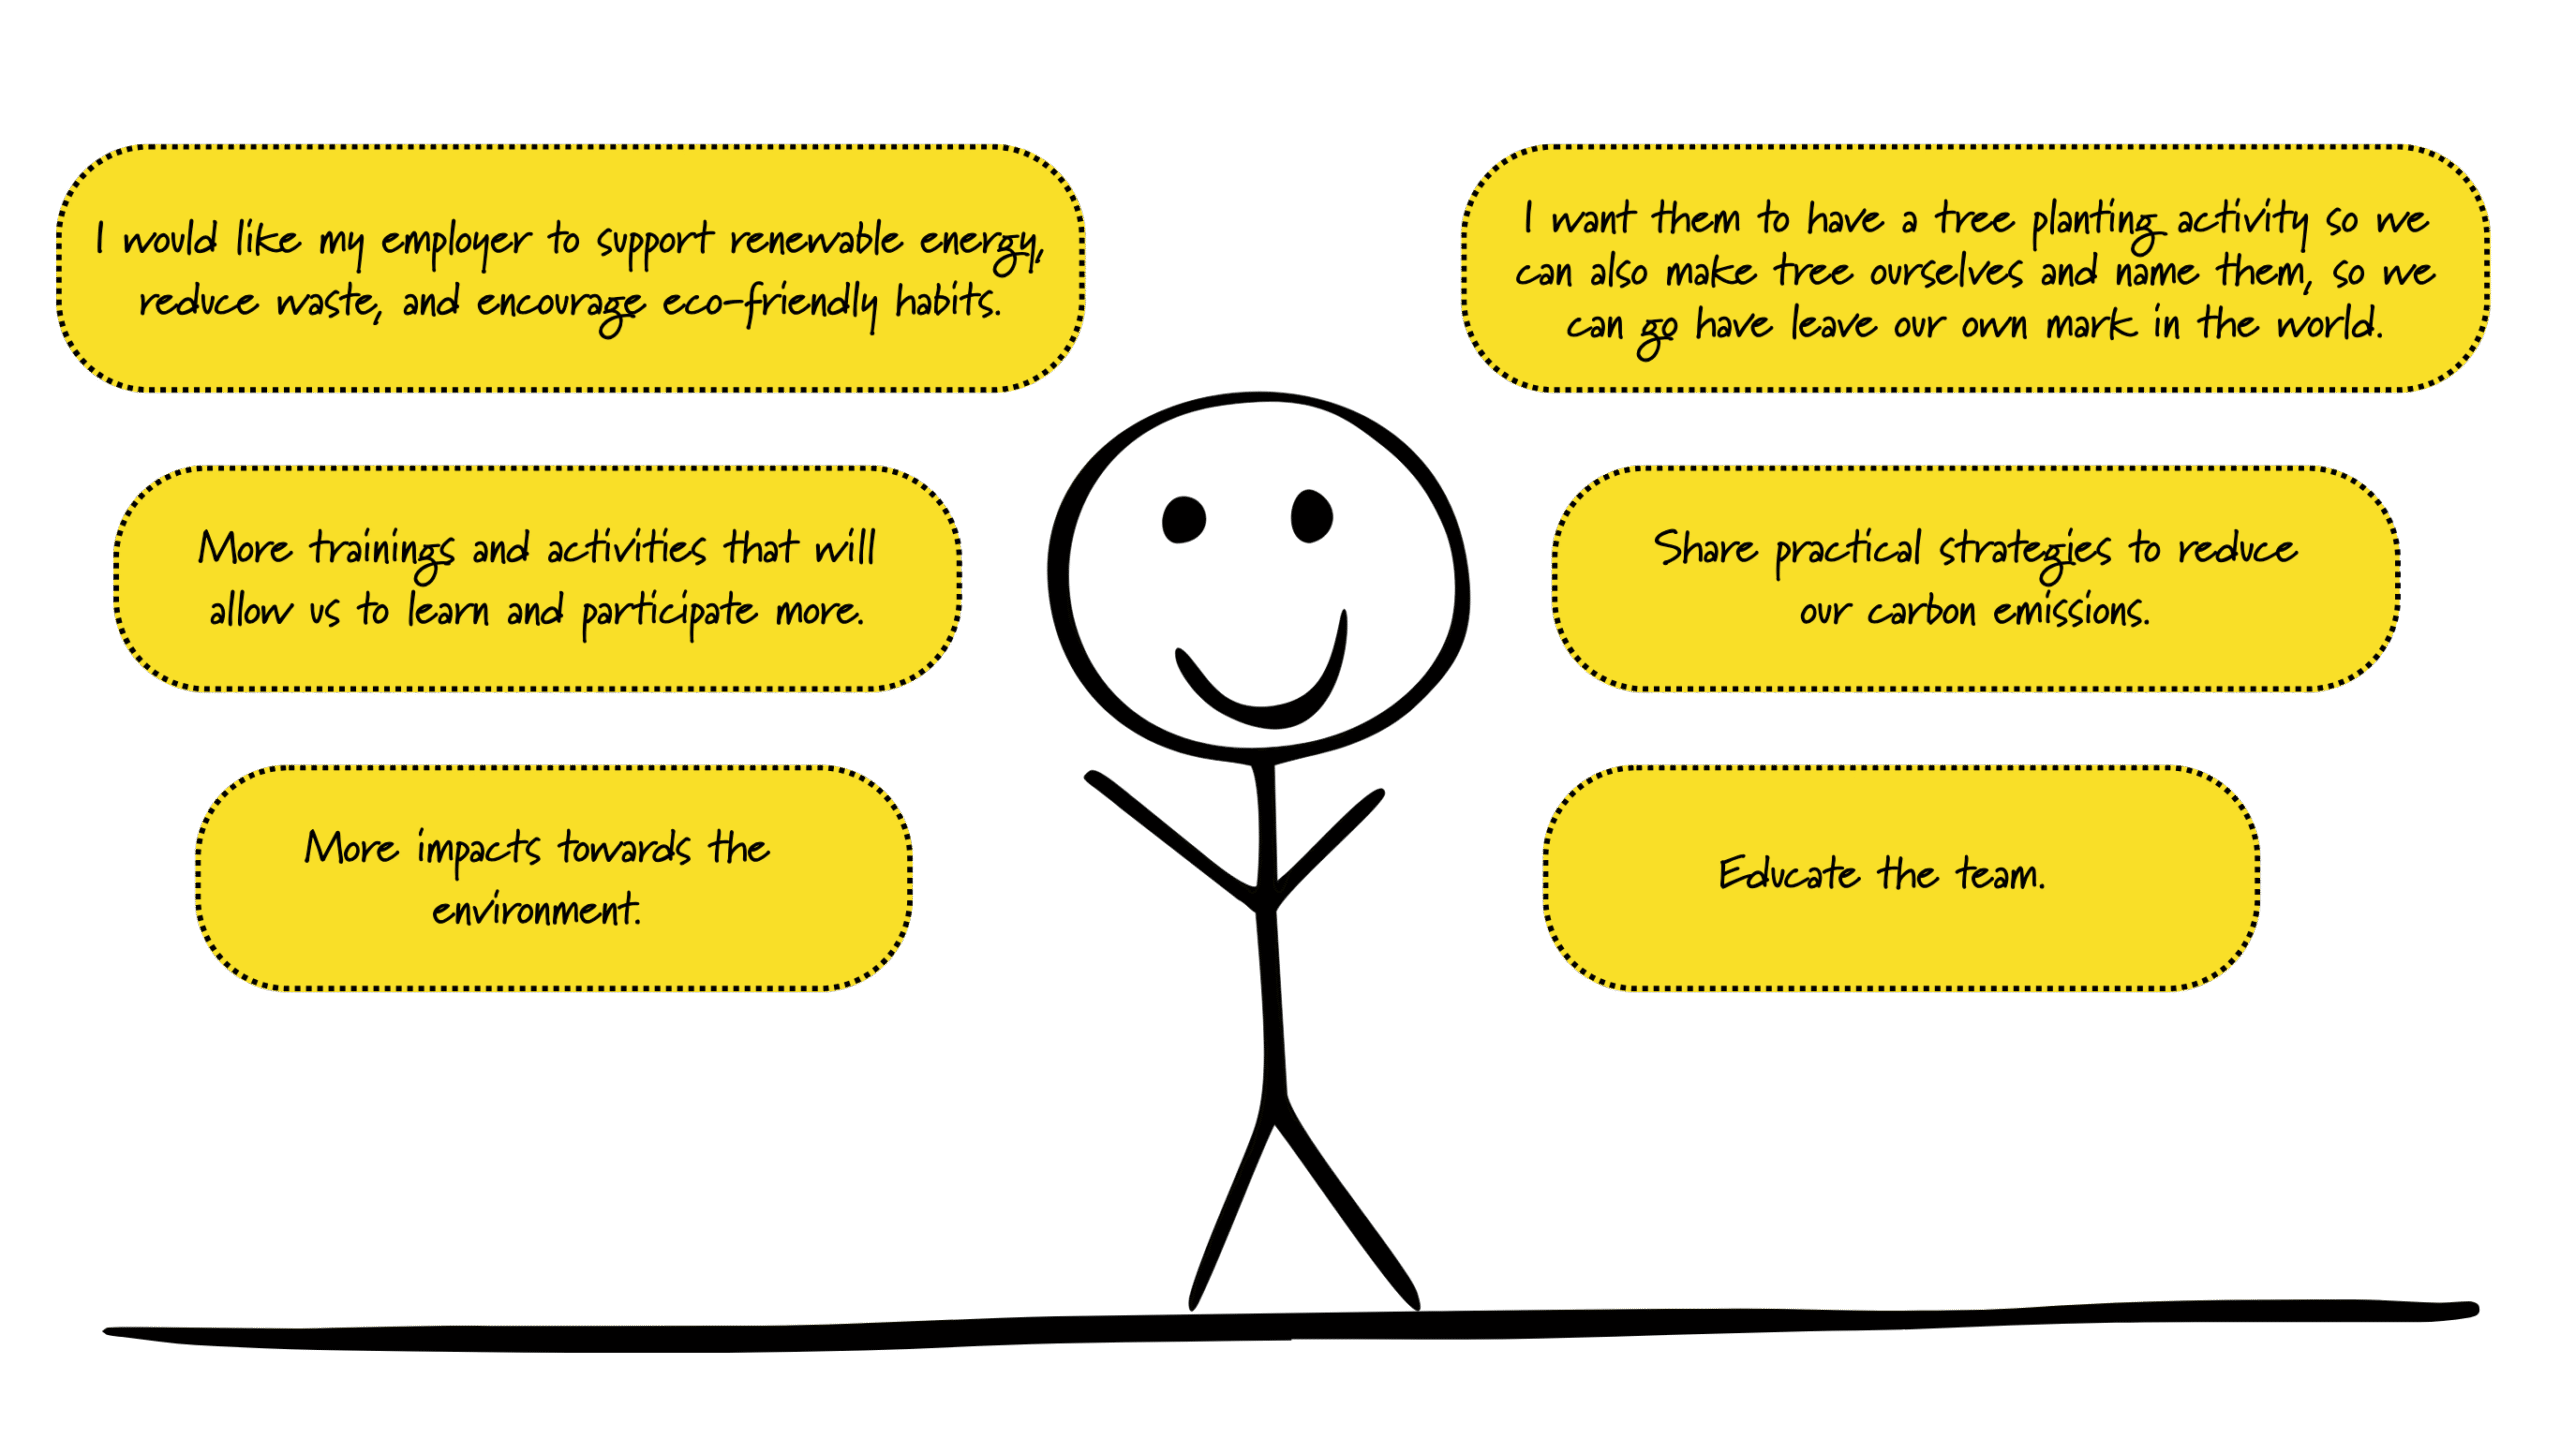
Whether it’s cutting emissions at work, choosing greener habits, or staying curious and accountable, we’re in this together—and proud of it.
Here’s what our team had to say when we asked: “What would you like to see your employer do more or less of to address environmental sustainability?
OUR IMPACT
Projects We’re Proud to Support
At MAD Wealth, we believe that doing good is part of doing business. That’s why we don’t just measure and offset our carbon footprint—we invest in real-world projects that create lasting impact. Below are some of the most recent initiatives we’ve helped fund, each chosen for its ability to drive meaningful change for people and the planet.
10% - Coorong Lakes Biodiversity Conservation, Australia
8% - Cool Fire Traditional Land Management, Australia
43% - Katingan Peatlands Conservation, Indonesia

27% - World Vision Clean Cookstoves