MAD Carbon Impact
Our 2022-2023 Sustainability Journey
The Bigger Picture
Making a Difference
One Tonne at a Time
At MAD Wealth, we believe that business can—and should—be a force for good. That belief drives everything we do, including how we manage our environmental impact.
In partnership with Trace, we measured our carbon footprint for the period July 2022 to June 2023. The results gave us a clear picture of where we stand and where we can do better.
What We Found
- Total emissions: 21.4 tonnes of CO₂e
- Per person: 2.1 tonnes CO₂e across our 10-person team
- Scope 3 emissions: 93% of our total footprint—typical for a service-based business like ours
OUR ‘MAD’ FOOTPRINT
A total carbon footprint of 21.4 tonnes of CO₂e—a baseline that reflects our operations across Australia and the Philippines. With a team of 10 full-time employees, that works out to 2.1 tonnes per person, which is relatively efficient for a professional services firm.
Where Our Emissions Come From
- Scope 1 (Direct emissions): We don’t own vehicles or burn fuel directly, so this category is effectively zero.
- Scope 2 (Indirect emissions from electricity): Electricity use contributed 1.5 tonnes CO₂e, accounting for 7% of our total emissions.
- Scope 3 (All other indirect emissions): This is where the bulk of our footprint lies—19.8 tonnes CO₂e, or 93% of the total. It includes everything from purchased goods and services to travel and commuting.
Top Emission Sources
- Purchased goods and services: 8.8 tonnes CO₂e (41.1%)
- Electricity consumption: 8.7 tonnes CO₂e (40.8%)
- Business travel: 3.4 tonnes CO₂e (15.8%)
Together, these made up over 97% of our total emissions. Our hybrid work model also influenced our footprint—less commuting, more home energy use.
Total Footprint: 21.4t
| Source | Emissions | % total emissions |
|---|---|---|
| Electricity | 8.7t | 41% |
| Business travel | 3.4t | 16% |
| Employee commute | 0.5t | 2% |
| Purchased goods & services | 8.8t | 41% |
| Waste generated | 0.3kg | <1% |
What This Tells Us
Our emissions profile is typical for a digital-first, service-based business. But it also shows us where we can make the biggest impact: smarter procurement, cleaner energy, and more intentional travel.
OUR BENCHMARK
Industry Benchmark
When it comes to carbon emissions, context matters—and that’s where industry benchmarks step in.
For the 2022–2023 period, our total emissions clocked in at 21.4 tonnes of CO₂e, which works out to 2.1 tonnes per employee across our 10-person team. As an accounting services firm, this positions us in a sector that typically sees lower direct emissions compared to heavy industries like manufacturing or construction.
Our footprint per FTE is 71% below oour peers in the same industry.
What Benchmarking Tells Us
Trace’s peer benchmarking tool compares our footprint against other accounting services businesses, looking at total and per-employee emissions. It also provides a confidence rating based on how many companies are in the dataset, ensuring the comparison is as accurate as possible.
Where We Stand
Our emissions profile is dominated by the usual suspects for our industry—electricity, business travel, and purchased goods & services—which is common across most office-based businesses. This means we’re not out of line with industry norms, but there’s still plenty of room to improve.
Why It Matters
Benchmarking isn’t just about where we stand today. It’s about seeing how we stack up against our peers, spotting opportunities, and setting realistic, science-based targets. By tracking this data year after year, we can measure progress and keep pushing toward becoming a leader in sustainable business practices.
Electricity
In 2023, electricity use accounted for 8.7 tonnes of CO₂e, making up a significant 40.7% of MAD Wealth’s total emissions. But here’s what’s surprising: 82.2% of that electricity footprint—7.2 tonnes—came from our team working remotely. The office itself contributed just 1.5 tonnes, or 17.8%, showing how our hybrid setup shifts the environmental load to home energy use.
While remote work helps cut down on commuting emissions, it’s not without its own impact. This data highlights the need to consider energy efficiency beyond the office—like how we power our homes and the choices we make around electricity use. Sustainability in a flexible work environment means looking at the full picture.

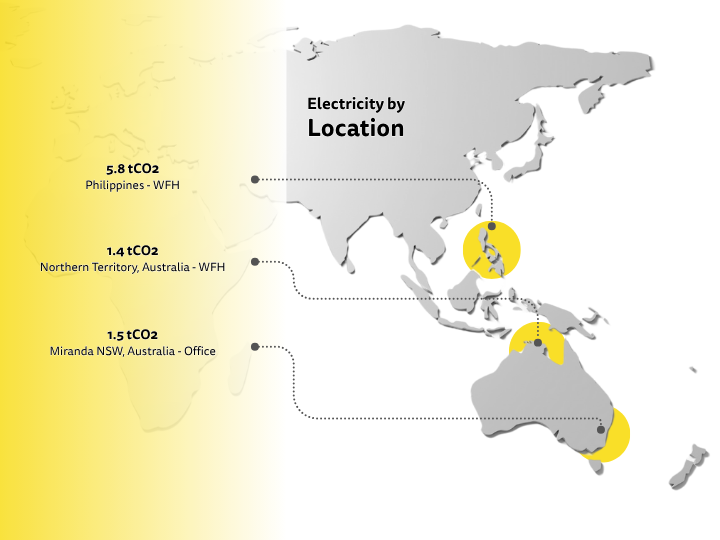
Electricity Emissions by Location
Not all electricity use hits the planet the same way. Here’s how our electricity footprint is split across where we work:
- Philippines – WFH: The clear frontrunner, with 5.8 tonnes of CO₂, accounting for 66.2% of our electricity emissions.
- Miranda NSW, Australia – Office: Our Miranda office space adds 1.5 tonnes of CO₂, or 17.8% of the total.
- Northern Territory, Australia – WFH: Close behind, the NT clocks in at 1.4 tonnes of CO₂, making up 16% of the total.
Business Travel
Our business travel in 2023 clocked in at 3.4 tonnes of CO₂e, making up 15.9% of our total emissions.
No shocker here—air travel takes the top spot, responsible for 60.7% of that footprint (a solid 2 tonnes). Accommodation follows with 32.5% (about 1.1 tonnes), and private transport barely nudges the needle at 1.1% (0.2 tonnes).
The takeaway? Flights are still the heavy hitters. If we’re serious about trimming this category, cutting down on air travel is the clearest first step.

Employee Commute
Our team’s commuting in 2023 contributed 0.5 tonnes of CO₂e—that’s about 2.3% of our total emissions.
Every bit counts, and even though this slice of the pie is smaller than some other categories, how we get to work still leaves a mark.
With personal vehicles being the main source, this is an area where small shifts—like carpooling, cycling, or working from home—could make a noticeable difference.
Purchased Goods & Services
In 2023, the things we bought—gear, services, and supplies—added up to 8.8 tonnes of CO₂e, making up 41.1% of our total emissions. That’s nearly half of our footprint coming from what we purchase.
The biggest slice? IT & telecommunication services, which accounted for a massive 67.8% of this category (6 tonnes). Professional services came next with 22.4% (2 tonnes), followed by smaller contributions from financial services (4.9%), events & entertainment (3.6%), and marketing & advertising (1.2%).
Waste Generated
Our waste-related emissions in 2023 totaled just 0.0003 tonnes of CO₂e—a tiny slice of our overall footprint, but still worth paying attention to.
Most of this—59.3%—came from mixed waste, while commingled recycling made up the remaining 40.7%.
Even though these numbers look small, every bit of waste contributes to the bigger picture.
With better recycling habits and smarter waste reduction strategies, we can make this category even leaner and show that no footprint is too small to improve.

OUR CARBON JOURNEY
Opportunities
We’ve identified the key areas where we can make the biggest dent in our carbon footprint for 2023, and the numbers tell a clear story.
Purchased Goods & Services
8.8 tCO₂e – 41.1%
This is our biggest lever for change.
- Conduct a supplier audit to cut unnecessary services.
- Engage with key suppliers to boost environmental transparency.
- Set a supplier target, like ensuring 50% of our suppliers have Net Zero goals by 2035.
Electricity
8.7 tCO₂e – 40.8%
High-impact, high-control.
- Switch to renewable or carbon-neutral energy providers.
- Run an energy audit and upgrade to energy-efficient tech (LEDs, better HVAC, etc.).
- Explore rooftop solar if it’s feasible.
Business Travel
3.4 tCO₂e – 15.8%
A medium-impact area, but within our control.
- Promote virtual meetings and reduce non-essential travel.
- When travel’s a must, opt for low-emission transport options.
- Create a travel policy that prioritizes sustainable choices.
Employee Commute
0.5 tCO₂e – 2.3%
Small numbers, but easy wins.
- Encourage hybrid/remote work to cut commute emissions.
- Support public transport, carpooling, or cycling incentives.
- Educate the team about low-emission commute options.
Targets
We’re taking a bold yet realistic approach to our emissions targets:
Main Target
Reduce Scope 1, 2, and 3 emissions by 50% by 2030, using 2023 as our baseline.
Milestones
We’ll set 2–3 year interim goals to make sure we’re always moving forward.
Track Progress
With an emissions intensity of 2.1 tonnes CO₂e per employee, we’ve got a clear baseline for measuring results.
Decarbonisation Plan
Our roadmap to Net Zero is all about action, not just ambition.
Immediate Actions (0–6 months):
- Switch to green energy providers.
- Audit our office energy use to spot efficiency gaps.
- Review and streamline supplier relationships.
Medium-Term (6–18 months):
- Roll out energy efficiency improvements.
- Launch a supplier engagement program.
- Set formal travel and commute policies.
Long-Term (2024–2030):
- Commit to science-based targets with clear milestones.
- Monitor and report annually to stay accountable.
- Engage our team with sustainability initiatives that drive impact.
OUR PEOPLE
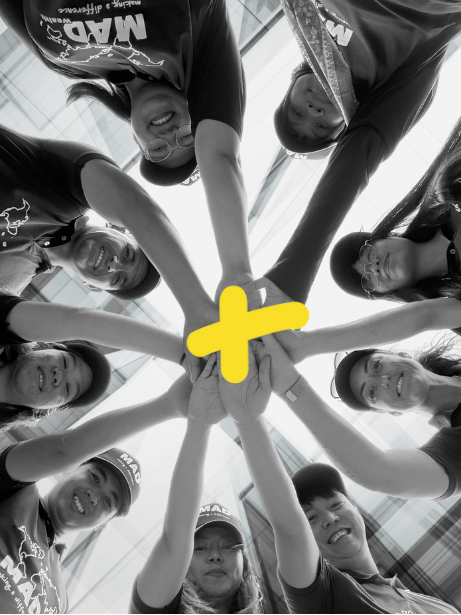
Climate Action Starts with Us
At MAD Wealth, sustainability is woven into everything we do. It’s not a separate initiative—it’s a shared mindset embraced by all 10 members of our team, both in the workplace and in our personal lives. Climate-conscious choices are part of our culture, from how we operate to how we live.
This collective commitment shows up in the details: reducing emissions in our day-to-day work, choosing low-impact suppliers, and adopting greener habits at home. We know it’s not about being perfect—it’s about making consistent progress, together.
Our efforts have earned recognition, but what matters most is the impact we’re making. By staying curious, accountable, and aligned in purpose, we’re proud to be building a business that’s better for the planet—and leading by example as we go.
OUR IMPACT
Investing in Impact
At MAD Wealth, we don’t just offset our carbon footprint—we invest in projects that deliver tangible, long-term benefits for people and the planet. Each initiative we support is chosen for its potential to create meaningful impact, whether it’s restoring ecosystems, supporting local communities, or driving climate resilience.
25% – Efficient cookstoves, Nepal
5% – Generating clean wind energy, India
25% – Coorong Lakes Biodiversity Conservation, Australia (stapled)

11% – Cool Fire Traditional Land Management, Australia